Team:AHUT-ZJU-China/Model

AHUT-ZJU-China
Model
According to our project modules, modeling was an integral part of our project, consolidating our experiment and analysis in subsequent ways:
Ø Assisting and predicting the behavior of our strains and enzyme experiment in the lab using Michaelis-Menten Kinetics and Enzyme Kinetic Model.
Ø Optimizing Enzyme Kinetic Model to simulate data that cannot be measured in the lab experiment.
Ø Using the created models to analyze and understand experiment behavior, as well as explain the degree of influence of the change of enzyme activity.
Introduction
In our lab experiment, we used carbonic anhydrase (CA) as the experimental enzyme to study its efficiency of $CO_{2}$ absorption. Our aim with the use of modeling can be broken down into three parts:
- Explain the mathematical principle that the concentration and the reaction rate change exponentially under the condition of single enzyme.
- Analyze the multiple factors that influenced the reversible reaction behaviors.
- Analyze the influence of different strains on the results.
To achieve the above goals, by studying and following lab experiment principles and process, we try to categorize our modelling into three parts:
- Michaelis-Menten Kinetics for predicting and explaining the phenomenon of changes of reaction rate in the lab experiment.
- Develop ODE equation for explaining the process principle of the final balance between the concentration of the substrate and the speed of the reverse reaction during the reversible reaction.
- Data analysis for exploring how the strain changes the relationship between enzyme activity.
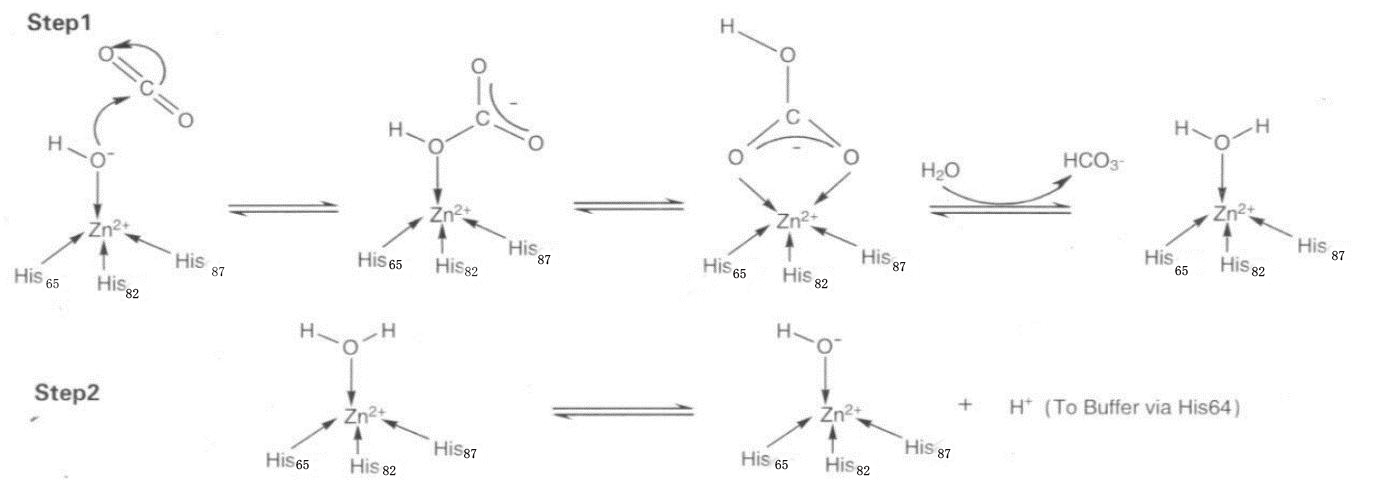
Project reaction mechanism:
Carbonic anhydrase (CA; bicarbonate lyase, EC 4.2.1.1) is a zinc-containing enzyme that catalyzes the reversible hydration of carbon dioxide:
$\begin{array}{l} \mathrm{CO}_{2}+\mathrm{H}_{2} \mathrm{O} \rightleftharpoons \mathrm{HCO}_{3}^{-}+\mathrm{H}^{+}\end{array}$
Enzyme Kinetic Model
Michaelis-Menten Kinetics
The Michaelis-Menten equation(MM equation) describes the kinetics of an enzyme-substrate interaction under a given set of environmental conditions. MM kinetics were used to describe the effective rates of product formation and consumption at each enzyme in the sequential reaction.
In our lab experiments, the process conforms to the single enzyme condition in the enzyme kinetic model, which is determined by the Michaelis equation as follows:
$v=\frac{\mathrm{d}[\mathrm{P}]}{\mathrm{d} t}=V_{\max } \frac{[\mathrm{S}]}{K_{\mathrm{M}}+[\mathrm{S}]}=k_{\mathrm{cat}}[\mathrm{E}]_{0} \frac{[\mathrm{S}]}{K_{\mathrm{M}}+[\mathrm{S}]}$
Here, $V_{max}$ represents the maximum velocity achieved by the system, at maximum (saturating) substrate concentrations. $K_{m}$ (the Michaelis constant; sometimes represented as $K_{s}$ instead is the substrate concentration at which the reaction velocity is 50% of the $V_{max}$.[S] is the concentration of the substrate S.
According to our experiments, the Michaelis-Menten equation can be:
$v_{\mathrm{}}=\frac{v_{max} [CO_{2}]}{K_{m}+\left[\mathrm{CO}_{2}\right]}$
The above equation can help us explain the phenomenon that the substrate concentration increases while the reaction rate gradually tends to a certain value in the experiment.
Michaelis-Menten equation data visualization
We used carbonic anhydrase 2 last year. It and this year's carbonic anhydrase 1 have both been confirmed to conform to the Michaelis equation, so this year we will expand on the data that has been verified. Assuming that the maximum speed is V, the data is as follows:
| Name | Constant |
|---|---|
| $K_{m}$ | 4 |
| $CO_{2}$ | 0~100 |
| $V_{max}$ | 8 |

ODE model of reaction process
No enzyme involved reaction
Carbon dioxide reacts in water to form $HCO_{3}^-$ and hydrogen ions. The hydroxide ions ionized by this reaction can react with carbon dioxide to form $HCO_{3}^-$.
$\begin{array}{l} \mathrm{CO}_{2}+\mathrm{H}_{2} \mathrm{O} \rightleftharpoons \mathrm{HCO}_{3}^{-}+\mathrm{H}^{+} \\ \mathrm{CO}_{2}+\mathrm{OH}^{-} \rightleftharpoons \mathrm{HCO}_{3}^{-} \end{array}$
After the study, we found that there is an intermediate state of $H_{2}CO_{3}$ in the reaction, which undoubtedly adds complexity to our modeling. The chemical reaction relationship is as follows.
We know that the proportion of $H_{2}CO_{3}$ in water is very small. We consider a method to prove this theory and simplify the reaction to a reversible reaction between $H_{2}O$ and $HCO_{3}^-$.

The reaction is reversible and we’re easy to get:
$k_{CO_{2}}=k_{31}+k_{32}$
Model assumptions:
- During the reaction, to achieve the status of reacting at a slower rate, under a certain concentration of $CO_{2}$($CO_{2}$ is not supplemented), the $CO_{2}$ consumption rate during the reaction is inversely proportional to the $CO_{2}$ concentration. The catalyst does not change the chemical equilibrium, so in order to achieve the chemical equilibrium, the catalyst not only accelerates the rate of the positive reaction, but also accelerates the rate of the reverse reaction, that is, the catalyst accelerates the rate of the positive reaction and the reverse reaction to the same extent, so it can finally reach the same equilibrium as when no catalyst is added.
- The activity of the enzyme does not change during the reaction, that is, assume the activity is only influenced by temperature and pH.
Model building:

The following ODE equations then can be obtained:
$\frac{dCO2}{dt}=-\nu_{CO2}*[CO2]$
$\frac{dHCO_{3}^{-}}{dt}=\nu_{HCO_{3}^{-}}*[HCO_{3}^{-}]$
Differentiating the model finely, we can obtain that the reaction rate of $CO_2$ is proportional to its own concentration, which is formed into $H^+$ and $HCO_{3}^{-}$ through the positive reaction, and $CO_{2}$+$H_{2}CO_{3}$ is regenerated through the reverse reaction of the intermediate state of $H_{2}CO_{3}$.
$\frac{dCO2}{dt}=-\nu_{1}\times [CO_{2}]+\nu_{h}\times [H_{2}CO_{3}]$
$\frac{dHCO_{3}^{-}}{dt}=\nu_{1}\times [CO_{2}]-\nu_{H_{2}CO_{3}}\times [HCO_{3}^{-}]$
$\frac{dH_{2}CO_{3}}{dt}=\nu_{H_{2}CO_{3}}\times [HCO_{3}^{-}]-\nu_{h}\times [H_{2}CO_{3}]$
SimBiology can be used to simulate the concentration of $CO_{2}$ and $HCO_{3}^{-}$ when the reaction reaches equilibrium. Because the data is too small to measure, we speed up the reaction and use SimBiology to simulate the reaction of CO2 in water. It can be seen that when reacting in water, even if we accelerate the positive reaction rate of $HCO_{3}^{-}$ to $H_{2}CO_{3}$, the data in the figure has little connection with $H_{2}CO_{3}$ molecules. **The reaction rate of $HCO_{3}^{-}$ to $H_{2} CO_{3}$ is much greater than the hydrolysis rate of $H_{2}CO_3$ itself**, which confirms In subsequent experiments, the intermediate state of the process of converting $H_{2}CO_{3}$ to CO2 can be omitted in the modeling. Considering the conversion of $HCO_{3}^{-}$ to $CO_2$, the model can be simplified to a single reversible reaction in the next model.

Model data:
| CONTANTS | VALUE |
|---|---|
| $\nu_{h}$ | 0.0026 |
| $\nu_{1}$ | $10^{-6.35}M$ |
| $\nu_{H_{2}CO_{3}}$ | $10^{-3.77}M$ |
Model simulation data:
| CONTANTS | VALUE |
|---|---|
| $\nu_{h}$ | 0.026 |
| $\nu_{1}$ | 0.00044M |
| $\nu_{H_{2}CO_{3}}$ | 0.00169M |
The above-mentioned ODE equation in this section explains the process principle of the final equilibrium caused by the correlation between the substrate concentration and the forward and reverse reaction speed in the reversible reaction process. The ODE equation also simplified the complexity of the handling of the the reaction in the subsequent modelling.
Enzyme involved reaction
If enzyme is involved, then the effect of the enzyme on the experiment can be understand as: reducing the activation energy of the reaction. However, the effect of enzyme on the reaction is essentially the effect on the reaction speed. Therefore, under the conditions of the presence of the enzyme, at the same temperature and pH value, the equilibrium conditions of the reaction will not change, but the speed at which the reaction reaches equilibrium will become shorter, which is understandable. Therefore, the speed of the positive reaction is accelerated, because the same equilibrium state is reached, the speed of the reverse reaction is also accelerated. Carbonic anhydrase is one of the fastest catalyzing enzymes and is called the "perfect enzyme". So this model is an extension of the actual experiment.
Quoting the above equation unchanged, reducing unnecessary variables that have little effect on the experiment, the equation is simplified to the following equation with other variables added:
$\begin{array}\mathrm{CO}_{2}\stackrel{\nu_{CO_{2}}}\rightarrow \mathrm{HCO}_{3}^{-} \end{array}$
$\begin{array}\mathrm{HCO}_{3}^{-}\stackrel{\nu_{h}}\rightarrow \mathrm{CO}_{2} \end{array}$
Model assumptions:
- Assuming that the relative temperature increase has a linear effect on the experiment.
- Assuming that the relative pH change has a linear effect on the experiment.
- Assume that C0 is the best temperature and PH0 is the best pH value.
Model building:
$\frac{dCO2}{dt}=-\nu_{CO_{2}}\times [CO_{2}]+\nu_{h}\times [HCO_{3}^{-}] + \nu_{c}\times|C-C_{0}|+\nu_{PH}\times|PH-PH_{0}|$
Model Optimization:
Calling from experience, the effect of temperature on enzyme activity should be exponential or high-order correlation. If this conclusion can be obtained from the data, then the equation for the $CO_{2}$ reaction rate (high-order correlation) can be established as:
$\frac{dCO_{2}}{dt}=-\nu_{CO_{2}}\times [CO_{2} ]+\nu_{h}\times [HCO_{3}^{-}]+ \nu_{c_1}\times|C-C_{0}|^{\lambda_1}+\nu_{PH_1}\times|PH-PH_{0}|^{\lambda_2} \tag{1}$
$\frac{dHCO_{3}^{-}}{dt}=\nu_{1}\times [CO_{2}]-\nu_{h}\times [HCO_{3}^{-}]+ \nu_{c_2}\times|C-C_{0}|^{\lambda_3}+\nu_{PH_2}\times|PH-PH_{0}|^{\lambda_4}\tag{2}$
Or change the ODE equation about $CO_{2}$ rate to become an exponential equation related to temperature and PH value.
$\frac{dCO_{2}}{dt}=-\nu_{CO_{2}}\times [CO_{2}]+\nu_{h}\times [HCO_{3}^{-}] + \nu_{c}\times|C-C_{0}|\times e^{\lambda_1}+\nu_{PH}\times|PH-PH_{0}|\times e^{\lambda_2}$
Because the equilibrium state of adding enzyme is the same as that without adding enzyme, and the simulation experiment can not accurately calculate the number of parameters, it can achieve the same balance as that without adding enzyme, so the calculation of parameters can be estimated by matlab equal step size, or the regression equation satisfying the above equation can be obtained from the data.
Enzyme, as a substance with high efficiency to catalyze chemical reaction under specific conditions, needs to be modeled in the experiment to find out which range of temperature / PH value is the best environment for the reaction. it needs to be modeled in experiments to find out which range of temperature/pH is the best environment for the reaction.
On the basis of this model, we can get the influence factors of temperature and pH value on the rate of $CO_2$ consumption. The more essential reason is that temperature and pH value affect enzyme activity. This model uses differential equations to control data that cannot be measured experimentally when other conditions remain unchanged.
Feasibility test of expressing different strains of the relationship.
We first tested the reliability of the data in the experiment, considering that the fitting may not have the desired effect, we gave up unnecessary steps. We want to conduct further research on the modeling of AHUT_CHINA in 2018. Through the method of modeling, we expect results obtain from the data can explain whether the effects of different strains on the enzyme activity of the experimental results are consistent, and whether the effects of different strains have analyzed value. The results of the experiment tell us that the differences in enzyme activity caused by different strains are small. The image (1) shows the feasibility of selecting enzymes in the experiment, the image (2) is a drawing, and the image (3) shows the changes caused by the expression of different strains. The differences are almost unnoticeable, which lie as pavement for the selection of expression strains in subsequent experiments.
Statistical model:
Boxplot statistics (image 1)

Line chart statistics (image 2)

Residual map (image 3)
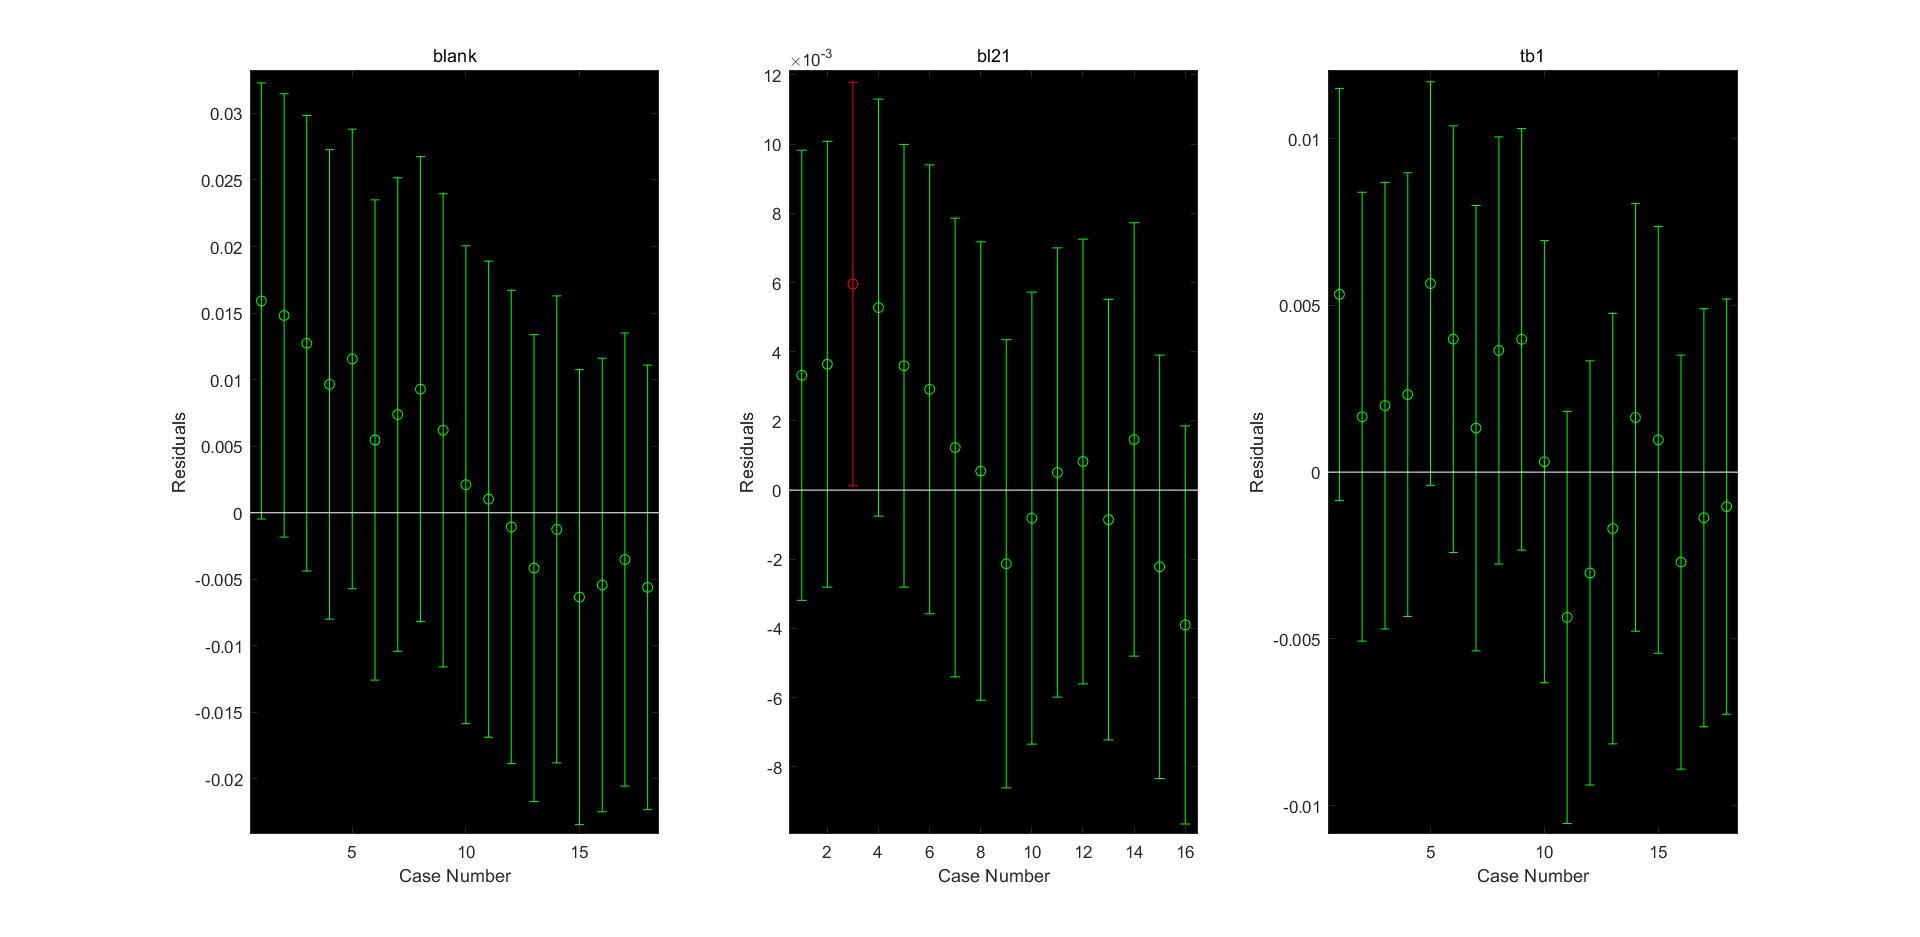
Average comparison (image 4)

For the comparison of the residuals caused by the two different expression strains at two wavelengths, because of the lack of one set of data, we correspondingly reduce the data of other groups when calculating the range.
Before reducing the data:
| res | ans |
|---|---|
| 385 | 0.870 |
| 385 | 0.820 |
| 401 | 0.390 |
| 401 | 0.400 |
After reducing the data:
| RES | ANS |
|---|---|
| 385 | 0.750 |
| 385 | 0.760 |
| 401 | 0.390 |
| 401 | 0.370 |
The chow test is used to test whether structural changes exist. Suppose that SC is the residual sum of squares of the combined data, S1 is the residual sum of squares of the first set of data, and S2 is the residual sum of squares of the second set of data. N1 and NX are the number of observations in each set of data, and k is the total number of parameters. The test value of Chow test is $\frac{\left(S_{C}-\left(S_{1}+S_{2}\right)\right) / k}{\left(S_{1}+S_{2}\right) /\left(N_{1}+N_{2}-2 k\right)}$, after chow test, we know that there is a structural change between the blank experiment and the bl21 control group, but there is no structural change between bl21 and tb1. This data shows that the expression between different strains The linear fitting structure satisfies a certain similarity in a certain range, indicating the feasibility of the experiment.
The test number obtained by calculation is less than 0.05. We have roughly got the results we want, although the value is very small, it does not accurately express the change in the linear structure.
| BP | P |
|---|---|
| bl21 | 0.0143 |
| tb1 | 0.0081 |
In addition, because chow test is rarely used and is often used in the financial field, after asking the teacher, we know that we can calculate the sum of the squares of the data residuals between the two groups of data, analyze the difference between blank and bl21,bl21 and tb1, and use the method of mathematical statistics to find the correlation between the two groups of data.
The results show that there is a big difference between blank and bl21, and a small difference between bl21 and tb1. This is the end of our proof.
| COM | value |
|---|---|
| inter1 | 0.10320 |
| inter2 | 0.01360 |
Linear fit:
Because the experimental data is one-dimensional, linear fitting is performed according to the experimental data at 385 wavelength. R_squared is small, 0.3564 and 0.2641, we consider to optimizing the data in the future modeling.


Conclusion:
- From the point of view of enzyme kinetics, we explained the exponential relationship between substrate concentration and reaction rate in the experiment.
- By simulating the reaction of $CO_{2}$ in water by SimBiology, magnifying the experimental parameters and simulating the reaction concentration curve, it is proved that the concentration of $H_{2}CO_{3}$ in the process of reaction between carbon dioxide and water is very small, which simplifies the subsequent modeling process.
- Based on the above model, the reaction ODE equations are established, and the effects of PH value and temperature on enzyme activity are taken into account. Even if there is no data, we can relate PH value to temperature in the reaction relationship between carbon dioxide and water.
- Through modeling to prove that the comparison used in the experiment is available, the range analysis method is used to obtain different fragments of expression and translation in the protein, resulting in basically the same degree of influence of the enzyme activity change, which provides a reliable basis for experimental selection of expression in theory and data .
Reference:
[1].TERRENCE L.DONALDSON AND JOHN A.QUINN.Kinetic Constants Determined from Membrane Transport Measurements:Carbonic Anhydrase Activity at High Concentrations
[2].马晓舟(2014). 耐热型重组碳酸酐酶的表达及酶学性质研究[D].浙江工业大学
[3].刘俏、齐小辉、范圣第.(2010.8)基于SimBiology生物反应过程的模拟,
[4].TH Maren.(1967)Structure and mechanism of carbonic anhydrase,
[5].V. L. Gaddy.(1940.1).The Solubility of Carbon Dioxide in Water at Various Temperatures from 12 to 40° and at Pressures to 500 Atmospheres. Critical Phenomena,
[6].Kernohan, J. C. (1964) The activity of bovine carbonican hydrase in imidazole buffers, Biochim. Biophys. Acta81, 346-356.
[7].DeVoe, H. & Kistiakowsky, G. B.(1961) The enzyme kinetics of carbonic anhydrase from bovine and humanerythrocytes, J. Amer. Chem. Soc. 83, 274-280.
[8].Robert P. Davis.(1958) The Kinetics of the Reaction of Human Erythrocyte Carbonic Anhydrase. I. Basic Mechanism and the Effect of Electrolytes on Enzyme Activity