
MFC
Both the wildtype strain of S. oneidensis MR-1 (WT) and the MtrB knockout (KO) strain were cultivated in the MFC. The media was fed to the MFC from a reservoir, and the spent media from the outflow was returned to the reservoir. This was done to allow the experiment to run without much supervision, as the flow rate was still relatively high and would otherwise require refilling every day. The cathode reservoir was effectively open to the atmosphere.
Wildtype strain
The biofilm growth of the wildtype strain was monitored for a total of 18 days (450 hours). The cultivation can be separated into four phases: two using LB to grow and confirm the biofilm growth, and two using M9 with lactate as the media feed to investigate the growth and biofilm integrity under lactate as the only carbon source. The calculated current for the entire run is shown in Figure 1.

Figure 1: Measurement of current over time in red, with the different phases in cyan
The first phase with LB as the carbon source lasted for 260 hours. The anolyte reservoir consists of 40 mL LB media. At the initial addition of the culture to the MFC anode chamber, the current is high but rapidly drops to 0 as the excess bacteria is flushed out of the cell. After several days, the current generated starts to rise above noise levels. The current increases steadily, and is at the end at 20 μA, indicating that a successful biofilm had formed in the MFC. There is however a chance that the electricity is from cells in suspension rather than a biofilm, as the media is recycled in the reservoir.
To confirm that the current generated is from a biofilm, the reservoir with 40 mL LB media is exchanged for a new 1000 mL bottle of LB. When the bottles are changed, there is a steep drop in current. It does not drop to 0 completely, but stays at around 8-10 μA for 5 hours. This could be due to cells in suspension that were contributing to the current were removed with the fresh reservoir, or it could be due to parts of the biofilm detaching when the flow is stopped during the media change, as predicted by literature. After the initial lag phase, the current generated rapidly increased over the course of 25 hours to a peak current of 130 μA. It is after that fairly constant, perhaps having entered a stationary phase due to nutrient limitation (which can occur with a reservoir), but more likely due to other limitations related to the biofilm, such as density or biofouling of the electrode.
The third phase of the MFC run with wildtype Shewanella oneidensis aimed to determine whether it could survive and produce electricity in M9 minimal media with lactic acid as the only carbon source. The LB media was exchanged for 1000 mL M9 media with lactate (instead of glucose). Immediately after the media change, the current dropped rapidly, but started to plane out after a few hours.
The current generated did not recover after two days, so more lactic acid (1 mL, 10 mM) was added to the reservoir. In the following hours, the generated current increased to a steady level, indicating that substrate limitation was the cause for the low current after media change.
Knockout
The biofilm growth (or rather, the lack of it) of the MtrB knockout (KO) strain was monitored for 130 hours (Figure 2). The setup was identical to the first phase of the wildtype strain run, with the exception of more bacteria being added at inoculation.

Figure 2: Measurement of current over time in cyan
The current starts off high but rapidly drops, similar to the wildtype run. Compared to the wildtype run however, the current doesn't increase, but remains at a low level. A comparison between KO run and the initial part of the WT run can be seen in Figure 3.
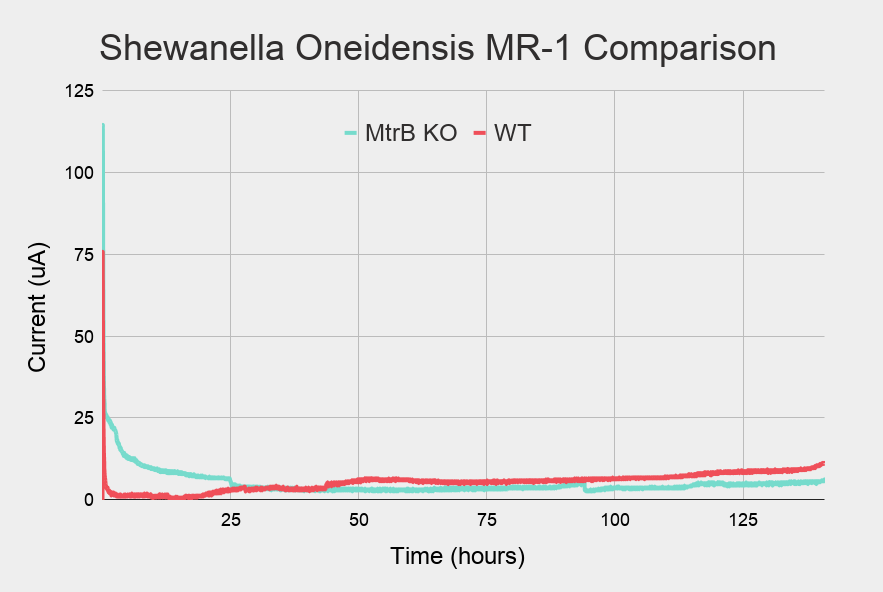
Figure 3: Comparison between the initial part of the WT current (in red) and the KO current (in blue) over time
Cloning
Aim of the cloning experiment was to get our choice of insert/construct into the plasmid pSB1C3. If the recombinant DNA was inserted successfully they were selected using antibiotic plates.
For controls we had:
- A negative control plate: Just the TOP10 E.coli cells were plated; nothing grew hence showing our plates with the antibiotics were selective.
- The backbone plasmid pSB1C3 with RFP in it was used to check successful ligation steps. Biobrick BBa_J04450 in pSB1C3 was used as our backbone, partial restriction digest could be easily detected with this backbone and the colonies picked for colony PCR could be narrowed down.
Restriction digest and ligation protocol was optimised for our backbone and gene blocks and they can be found in the Notebook.

Figure 4: Transformed E.coli that took up the recombinant DNA
The colonies that grew on the plate could either have the construct or could be an empty backbone. To find the correct colony a colony PCR was run. The ones with the correct size constructs run on an agarose gel are compiled here, for more information on the protocol check the Experiments page.

Figure 5: Constructs with the right size for B, L, M, C, D and F

Figure 6: Constructs with the right size for G, J, H and F

Figure 7: Constructs with the right size for N,Q,P,O and plasmid 3.2

Figure 8: Constructs with the right size for Q, E, H
For each construct multiple right size band samples were found, these were sent out for sequencing to find the sequence with no mis alignments or alignments that gave the same amino acid sequence as an output.

Figure 9: Sequence comparison for construct O (top) and F (bottom)
12 constructs were found to have the right alignments. A summary of the cloning experiment result is shown below.
| Constructs | Code | Size | Selection of sequence |
|---|---|---|---|
| Constitutive promoter-RFP | Ctrl (Control) | 1069 | / |
| Constitutive promoter- LuxI- Myc tag | A | 1158 | A3 but resequence end of LuxI w/ new primers |
| Promoter prmA- mcherry | B | 1492 | B7, B8 |
| Promoter bphR1- mcherry | C | 1361 | C3 but mismatch in promoter and gap after it |
| Promoter Lux-GFP | D | 1113 | D1 |
| Promoter Rhl-GFP | E | 1111 | E5 |
| Promoter prmA-LuxI-Myc tag | F | 1159 | F5 (F7 has a mismatch) |
| Constitutive promoter- RhlI- Myc tag | G | 1045 | G7 |
| Constitutive promoter-AiiA - Myc tag | H | 1189 | / |
| Constitutive promoter-RhlR - Myc tag | J | 1299 | (J3 has a mismatch) |
| RhlI-RBS-Aiia | K | 1779 | K5,K11 |
| Constitutive promoter-bphR2 - Myc tag | L | 1443 | L3 |
| Promoter bphR1-LuxI-Myc tag | M | 1288 | M1 |
| Constitutive promoter- GFP | N | 1266 | N3 |
| Constitutive promoter- RhlR- Myc tag- Promoter Rhl-GFP | O | 2107 | O14,O19 |
| Constitutive promoter-LuxR - Myc tag | P | 1328 | / |
| Constitutive promoter- LuxR- Myc tag- Promoter Lux-GFP | Q | 2135 | Q3 |
| Constitutive promoter-bphR2-Myc tag -double terminator-Pbphr1--LuxI | plasmid 3.2 | 2493 | P3.2-4 (middle part should be resequenced) |
Viability assays
The successfully transformed cells with our pollutant-sensing gene inserts were checked for their survivability in the presence of the pollutants as compared to the un-transformed cells. This was done using the Viability assay exploring the population growth curve in a range of pollutant concentrations.
| Constructs | Code | Construct Detects |
|---|---|---|
| Top 10 E. coli BL21 (no plasmid) | Ctrl (Control) | N/A |
| Promoter prmA-LuxI-Myc tag | F | PFOS |
| Constitutive promoter-bphR2 - Myc tag - promoter bphR1-LuxI-Myc tag | Plasmid 3.2 (P 3.2) | PCB/1,1-biphenyl |
Initially, the pollutant concentration range used for the viability assays mimicked the concentration range of the pollutants as found in nature. The initial results suggested that our strains were not affected in terms of their population growth at concentrations this low. Hence, we aimed to find the threshold levels for these pollutants at which the growth would be affected, enabling us to set a maximum range for the pollutant concentration at which our strains and in turn our biosensor system would be capable of functioning. These results can be found below.

Figure 10: The figure represents the growth curves of Top 10 E. coli BL21, constructs F and plasmid 3.2. Samples were incubated in different concentrations of PFOS and 1,1-biphenyl for 18 h at 37°C. The red line represents the OD600 value and the blue line is after adjustment to the blank (well H7)

Figure 11: Key to layout for Figure 10 denoting samples and pollutant concentrations
The viability assay shows that our host cells with or without the pollutant sensing constructs are not severely affected by the addition of pollutants in terms of their population growth. An effect on the growth curve can be seen for the highest concentrations for 1,1-biphenyl at 10-3M (wells A1-3, C7-9 and F1-3) and for PFOS at 125 μM (wells B4-6, D10-12 and G4-6). This suggests that these concentrations may be in the range of toxicity threshold values for our bacterial cells. However, these concentrations are well above current concentrations of these pollutants in nature around the Baltic sea hence suggesting that our system would be able to withstand these pollutants while not impacting their growth.
Once the survivability of the transformed cells in various concentrations of the pollutants was proven; characterization of these various constructs was the next step.
Characterization
To make sure that our final sequence was in fact expressed as well as functional we methodically divided the construct and added extra sequences that would help us with characterization such as fluorescence markers or Myc tags. This was useful in troubleshooting the subparts of the final construct that needs more modeling and analysis to give out the desired proteins. Different techniques were applied to characterize the various constructs outlined in Experiments.
Fluorescence
Some of our constructs with the pollutant detection ability had mCherry sequence at the end and some of the constructs with the quorum sensing genes had GFP sequence. Fluorescence intensity of these constructs were measured both in uninduced conditions; to obtain a threshold signalling level of the promoters, and in induced conditions; to assess the degree of activation of the promoter by the inducers (i.e. AHL and/or pollutants). Inducers were added to cultures along with the constructs to be tested, and incubated overnight (Table 3). Constructs not expressing fluorescent proteins were included as controls. The results are summarised in Figure 12.
| Construct | Code | Fluorescent protein | Induced with AHL synthase constructs | Induced with synthetic AHL | Induced with pollutants |
|---|---|---|---|---|---|
| constitutive promoter- GFP | N | GFP | N/A | N/A | N/A |
| constitutive promoter- RhlR- Myc tag- promoter Rhl-GFP | O | GFP | co-culture with G | 2 μM C4-HSL | N/A |
| constitutive promoter- LuxR- Myc tag- promoter Lux-GFP | Q | GFP | co-culture with A | 2 μM 3OC6-HSL | N/A |
| promoter prmA- mCherry | B | mCherry | N/A | N/A | 62.5 μM PFOS |
| promoter bphR1- mCherry | C | mCherry | N/A | N/A | 10-4M 1,1-biphenyl |
| constitutive promoter- LuxI- Myc tag* | A* | N/A | N/A | N/A | N/A |
| constitutive promoter- RhlI- Myc tag* | G* | N/A | N/A | N/A | N/A |

Figure 12: Net fluorescence intensity of constructs expressing (a) mCherry and (b) GFP. The values shown represent averages of 3 technical replicates, and have been adjusted for cell density. Error bars represent standard deviation

Figure 13: GFP visualisation of constructs O14, O19 and Q under UV light
The green fluorescence intensity of constructs O and Q increased upon induction with synthetic C4-HSL and 3OC6-HSL, respectively (Figure 12b). This suggests that the synthetic AHL molecules could bind to RhlR (constitutively expressed by construct O) and LuxR (constitutively expressed by construct Q), which could subsequently induce their respective promoters (pRhl and pLux) and therefore induce higher GFP expression. Co-culturing constructs O and Q with constructs G (which constitutively expresses RhlI) and A (which constitutively expresses LuxI) respectively induced a similar increase in GFP expression. These results suggest that AHL molecules were produced by RhlI and LuxI, which could in turn bind to RhlR and LuxR and induce the specific promoters and expression of GFP. The results of this functionality assay are supported by the Western blot results, which showed the expression of Myc-tagged LuxI (A), RhlI (G) and LuxR (Q).
The expression of mCherry by constructs B and C did not increase when induced with pollutants (Figure 12a). Construct C expresses mCherry under a bphR1 promoter, which is induced by the protein bphR2 binding to biphenyl. As no bphR2 was added, the expression of bphR1 promoter could not be induced by addition of biphenyl alone. However, the expression of mCherry by construct B (under prmA promoter) was not increased upon addition of the given concentration of PFOS. The concentration of pollutants used for characterisation were selected based on the results of the viability assays, such that they do not affect the growth of bacteria significantly. For future experiments, higher concentrations of pollutants could be added to induce the constructs. This would also help in setting a detection limit for the system.
Western Blot
The constructs with a Myc tag at the end were characterized using the Western blot technique. The protocol was adjusted throughout the experimental period for several factors in order to optimize the protocol and ensure optimal protein expression. A positive band corresponding to the right size suggests that the gene inserted for the desired protein has been successfully translated, although functional assays are required to confirm successful protein function. This was carried out for some of the constructs through fluorescence experiments such as construct Q (LuxR) induced by the protein expressed by construct A (LuxI) (Figure 14).
Several parameters were adjusted (see our WB troubleshooting guide) throughout the experimental period:
- Cell culture density at lysis (in order to optimize protein expression according to cell growth phase)
- Concentration of inducer (pollutant or QS signalling molecule)
- Increased blocking time
- Increased incubation time with antibodies
The results presented here are as obtained after several repeated trials. The same positive bands for the same samples appeared over several consecutive Western blots and were hence reproducible (see notebook for all Western blot results). In general, pollutant-inducible constructs were induced with the pollutants overnight.
| Constructs | Code | Protein Tag | Induced with pollutants (o/n) | Protein Size + Myc-tag (kDa) | Correct Sequence |
|---|---|---|---|---|---|
| Constitutive promoter- LuxI- Myc tag | A | c-Myc-tag | N/A | 23.1 | Yes* |
| Constitutive promoter- RhlI- Myc tag | G | c-Myc-tag | N/A | 23.8 | Yes* |
| Constitutive promoter-LuxR - Myc tag | P | c-Myc-tag | N/A | 29.8 | No |
| Constitutive promoter-RhlR - Myc tag | J | c-Myc-tag | N/A | 29.4 | Mismatch |
| Constitutive promoter- LuxR- Myc tag- Promoter Lux-GFP | Q | c-Myc-tag | N/A | 29.8 | Yes* |
| Constitutive promoter- RhlR- Myc tag- Promoter Rhl-GFP | O | c-Myc-tag | N/A | 28.8 | Yes |
| Constitutive promoter-bphR2 - Myc tag | L | c-Myc-tag | N/A | 35.1 | Yes |
| Promoter bphR1-LuxI-Myc tag | M | c-Myc-tag | 10-4 M 1,1-biphenyl | 23.1 | Yes |
| Promoter prmA-LuxI-Myc tag | F | c-Myc-tag | 62.5 μM PFOS | 23.1 | Yes |
| Constitutive promoter-bphR2 - Myc tag - promoter bphR1-LuxI | Plasmid 3.2 (P 3.2) | c-Myc-tag | 10-4 M 1,1-biphenyl | 35.1 | Not fully sequenced |
| FtsH1Myc** | Pos Control | c-Myc-tag | N/A | 71.2 | N/A |
| Constitutive promoter- GFP | Neg Control | None | N/A | N/A | Yes |
The results presented here are as obtained after several repeated trials. The same positive bands for the same samples appeared over several consecutive WBs and were hence reproducible (see notebook for all WB results). The constructs, namely F and plasmid 3.2, designed to be induced by pollutants were tested in uninduced as well as induced conditions. The pollutant concentration used for induction corresponded to the maximum pollutant concentration threshold without an impact on their growth, as determined by the viability assay (Figure 10). Construct M, consisting only of the the bphR1 promoter, hence lacking the gene bphR2 was also tested in uninduced as well as induced conditions. This allowed for assessment of the potential inducibility of this promoter in absence of bphR2. Negative controls lacking a Myc-tag as well as positive controls (confirmed Myc tag on WB) were included.

Figure 14: WB results of samples in table 4 (the one right above this) with positive bands for positive control, LuxI (A), RhlI (G) and LuxR (Q) in that order. M + biphenyl, F + PFOS and P3.2 + biphenyl were induced by pollutants according to table 4
The above results show positive results i.e. successful protein translation of the proteins LuxI, RhlI as well as LuxR. Construct P was not successfully inserted as confirmed by sanger sequencing, this construct however was designed to express LuxR which was successfully transformed and translated through construct Q. It was still tested however on this blot as a form of negative control. Construct J, i.e. RhlR had a mismatch in the genetic sequence and did not generate a positive band in repeated WB trials. Constructs O14 and O19 were the same constructs and had both correct sequences yet neither yielded positive bands. Construct L consisted of the bphR2 protein required for biphenyl sensing and had a confirmed correct sequence yet did not generate a positive band. The constructs inducible by pollutants did not generate positive bands in uninduced or induced conditions. To be noted however that some parts of P3.2 was not able to be sequenced.
We used a blue safe protein stain to further troubleshoot the lack of positive bands for the constructs with correct sequences. Information of whether the general protein expression in the cell was inhibited due to the gene inserts themselves being unfavourable to our host cells could be explored through general staining of the proteome. It seemed that there was no prominent difference in the proteomic expression among different constructs.

Figure 15: Blue safe protein staining of samples in table X (the one right above this) with positive bands for positive control, LuxI (A), RhlI (G) and LuxR (Q) in that order. M + biphenyl, F + PFOS and P3.2 + Biphenyl were induced by pollutants according to table x
The WB results can be interpreted in several ways. One interpretation is that the constructs lacking positive bands are in fact not expressing the desired proteins despite most of them carrying the correct genetic inserts as confirmed by sanger sequencing. There are however several other assays one would like to perform before drawing that conclusion. Future experiments in order to troubleshoot the lack of protein expression could entail:
- RNA extraction (in order to pinpoint where in the process of protein expression there could be a problem such as in the mRNA).
- Increasing the pollutant concentration for induction of constructs F and Plasmid 3.2.
- Cell lysis at different time points in their growth phase, to analyse a potential change in protein expression corresponding to different time points.
- Probing for a host protein may also aid in understanding differences in total protein expression and could help in quantifying the protein expression for the positive bands.
- The adjacent sequence to the Myc tag in our protein sequence might affect the functionality of the protein Zordan et al., 2015 as well as the antibody-binding ability Schüchner et al., 2020. Redesigning the construct sequence, altering the placement of the Myc tag, increasing the number of tags or replacing the tag to another such as a His-tag might hypothetically prove more favourable for some of our constructs, and could be further explored in future studies.
Chromobacterium violaceum
This assay was done for the constructs that produced AHL (N-acyl homoserine lactones) which can be detected using Chromobacterium violaceum. We used a stock solution of 100 μM C4-HSL and 3OC6-HSL in Milli-Q to prepare agar with varying concentrations of AHL (C4-HSL and 3OC6-HSL). A 48 well plate containing Chromobacterium and agar with AHL was prepared as follows:
| 1 | 2 | 3 | 4 | 5 | 6 | 7 | 8 |
|---|---|---|---|---|---|---|---|
| control (no cells), C4-HSL | control, C4-HSL | 0.1 μM, C4-HSL | 0.2 μM, C4-HSL | 1 μM, C4-HSL | 2 μM, C4-HSL | 10 μM, C4-HSL | 20 μM, C4-HSL |
| control (no cells), C4-HSL | control, C4-HSL | 0.1 μM, C4-HSL | 0.2 μM, C4-HSL | 1 μM, C4-HSL | 2 μM, C4-HSL | 10 μM, C4-HSL | 20 μM, C4-HSL |
| control (no cells), C4-HSL | control, C4-HSL | 0.1 μM, C4-HSL | 0.2 μM, C4-HSL | 1 μM, C4-HSL | 2 μM, C4-HSL | 10 μM, C4-HSL | 20 μM, C4-HSL |
| control (no cells), 3OC6-HSL | control, 3OC6-HSL | 0.1 μM, 3OC6-HSL | 0.2 μM, 3OC6-HSL | 1 μM, 3OC6-HSL | 2 μM, 3OC6-HSL | 10 μM, 3OC6-HSL | 20 μM, 3OC6-HSL |
| control (no cells), 3OC6-HSL | control, 3OC6-HSL | 0.1 μM, 3OC6-HSL | 0.2 μM, 3OC6-HSL | 1 μM, 3OC6-HSL | 2 μM, 3OC6-HSL | 10 μM, 3OC6-HSL | 20 μM, 3OC6-HSL |
| control (no cells), 3OC6-HSL | control, 3OC6-HSL | 0.1 μM, 3OC6-HSL | 0.2 μM, 3OC6-HSL | 1 μM, 3OC6-HSL | 2 μM, 3OC6-HSL | 10 μM, 3OC6-HSL | 20 μM, 3OC6-HSL |

Figure 16: Plate reader readings for chromobacterium with various AHL concentrations
Readings from plate reader did not correspond to colour change in the agar wells. Only the highest concentrations of 3OC6-HSL appeared to cause a colour change. To troubleshoot this part we went on to do a preliminary test to check if there was any colour change seen in the presence of AHL. A plate with Chromobacterium was grown onto which stock 100uM AHL solution was spread. Unfortunately there was no color change observed. This could possibly be because the AHL in the stock solution had degraded as it was kept at room temperature.

Figure 17: Chromobacterium on agar plate. The circled area indicates the area where 3OC6-HSL was added
This experiment was repeated with Chromobacterium plates using freshly prepared AHL (2μL of a 10mM AHL in acetonitrile) on plates. Purple colour was observed around the droplet areas, more for 3OC6 than C4. Also the immediate area around the droplet was found to be empty, presumably due to acetonitrile toxicity.

Figure 18: Colour change seen on chromobacterium plates at 10mM AHL
Once the concentration at which colour change was observed was found, the constructs were tested on the chromobacterium plates. Overday cultures of A and G were tested on separate plates and a control of only Chromobacterium plate was used.

Figure 19: Control with only Chromobacterium, A+Chromobacterium and G+Chromobacterium
A different experimental setup was planned with two plates on which Chromobacterium and the AHL or bacteria were grown adjacent to each other. This consisted of the strains transformed constructs A and G, control: Top 10 E.coli, C4-HSL and 30C6-HSL.

Figure 20: (a) Plate setup for Chromobacterium reaction comparison. (b) No color change observed on the plates
There was no colour change observed on any plates; this could possibly be due to the less growth of the Chromobacterium and the Top 10 E.coli as the cultures were grown for almost 24 hours and the cells might have died before plating.
Hence from the Chromobacterium assay it was seen that pure AHL at a concentration of 10mM gave a clear colour change visible to naked eyes. However in case of the constructs there wasn't a huge difference. Although from the Western blot the same constructs A and G gave clear bands multiple times it could be concluded that the proteins were being formed but the concentration of the proteins formed were too low to be detected by the Chromobacterium plates prepared. Further literature review to better this experiment is needed to improve.