Team:UESTC-Software/Engineering
<!DOCTYPE html>

Overview of iteration process

Project Design
After many iterations, we built the project in the following way.
Data Integration
To facilitate user's utilization of the domains we have divided, we made full use of the current mature database resources. Considering the scientificity of protein domain division, we used same naming of domains with CATH and SCOP. We crawled the functional annotations related to our domain classification on Go so that user's could easily know functions in which the domain might be involved. In addition, we also examined the binding score between different shape classifications and gave the recommended binding scheme, so as to minimize the risk that the selected two types of proteins could not bind.
Our project integrates 3 databases, including CATH [1], SCOP [2] /SCOP2 [3], and references 2 databases including PDB [4] and UniProt [5]. All the information is contained in CPD3DS which has been verified by experiments, which ensures the high reliability of the data.
CATH
The CATH database is a free, publicly available online resource that provides information on the evolutionary relationships of protein domains.
CATH-Plus data includes:
FunFams (Functional Families)
The homologous superfamilies in CATH-Gene3D can often be functionally and structurally diverse even though they share a conserved structural core. Therefore, the superfamilies have been sub-classified into functional families (FunFams) using a subclassification protocol purely based on sequence patterns. Relatives within these FunFams are likely to share highly similar structures and functions. The FunFams are useful in function prediction and in providing information on the evolution of function.
Structural clusters
The structures within a homologous superfamily have been clustered at < 9 Å RMSD to form structural clusters, also known as structurally-similar groups (SSGs). These structural clusters are useful for understanding the structural diversity of a superfamily.
SCOP/SCOP2
Belongs to the secondary protein structure database.
The classification of SCOP and SCOP2 is based on four levels: type (secondary structure component), family (spatial geometric relationship), superfamily (distant protein evolution relationship) and folding (close protein evolution relationship).
UniProtKB
Its three-level database:
UniPrac: A large number of protein sequences included in all UniProt database sub-libraries.
UniRef: Summarize several major databases of UniProt and repeat the series after removal.
UniProtKB: Databases with detailed annotations and links to other databases are divided into UniProtKB , Swiss-Prot , UniProtKB and TrEMBL . Among them , the data in Swiss-Prot is obtained from the experiment, and the annotation is completed after manual inspection, and TrEMBL is the annotation completed automatically.
PDB
The search part displays the basic information about the protein. If you want to see other information, download a . pdb file in PDB format. The file can be opened with Notepad. The file includes: molecular category, keywords, method of determining structure, and primary structure information , Amino acid sequence, modification of standard residues, secondary structure, chemical bonds between residues, 3D coordinates (atomic coordinates), atomic bond information, etc.
De-redundancy
We downloaded all the PDB files on the PDB database and reduced their redundancy by cd-hit [6,7,8,9,10,11].
The input file of CD-HIT only has a FASTA format file. Generally speaking, the input file of CD-HIT is to cluster the gene or protein sequences of several samples, so the sequences of these samples need to be summarized together as the input file.
Cd-hit has two types of output files: one is a FASTA file that only contains representing sequences without redundancy;The other is a cluster information file ending in. clSTR, the file's format is shown in the figure below.
>Cluster 0 |
0 2799aa, >PF04998.6 |RPOC2_CHLRE/275-3073... * |
>Cluster 1 |
| 0 2214aa, >PF06317.1|Q6Y625_9VIRU/1-2214... at 80% |
| 1 2215aa, >PF06317.1|009705_9VIRU/1-2215.. . at 84% |
| 2 2217aa, >PF06317.1lQ6Y630_9VIRU/1-2217.. . * |
| 2 2217aa, >PF06317.1lQ6Y630_9VIRU/1-2217.. . * |
The one beginning with ">" is a clustering group. Each group is arranged by the sequence number. As shown in the figure above, there are 5 cluster sequences in Cluster 1 group and each of them has a percentage or a sign "*". The percentage represents the similarity between the sequence and the representative sequence and the sign "*" represents the sequence is the representative sequence of the cluster.
Preliminary de-redundancy took 80% similarity as the basic parameter to perform de-redundancy operation after which 33, 455 de-redundant data were obtained.

Feature extraction algorithm
The 3D-Zernike descriptor ( 3DZD )[13] can be used to effectively compare the surface shapes of single chains, single domains or single complexes in the latest protein database ( PDB ) with all protein structures.
The 3D-Zernike descriptor ( 3DZD ) is a combination of coefficients calculated from a set of well-defined orthogonal 3D basic polynomials that approximate a given 3D function (a grid of discrete surfaces). 3DZD has various ideal characteristics when applied to describe protein surface shape:
|
1.Rotation invariance: Protein comparison does not require prior structural comparison. |
2.Tightness: The surface of a protein can be closely represented as an eigenvector with only 121 Numbers (which is called invariant). These vectors can be compared by calculating Euclidean distance in a short time which allows rapid shape retrieval. |
|
3.Layered resolution: The invariant of lower resolution is also part of the higher resolution. For example, the first 12 numbers in 121 invariants represent the same protein at a lower resolution. |
By calculating the Euclidean distance of 121 eigenvector of two proteins, the similarity of the two proteins' shapes can be estimated.
Clustering
Introduction to Kmeans clustering algorithm
Due to its excellent efficiency and good scalability, K-means clustering [12] algorithm is regarded as one of the most famous clustering method. K-means algorithm is a process of repeatedly moving the center point of a type. The center point of the type also known as centroids is moved to the average position of its containing members, and then its internal members are re-divided.
The K-means algorithm has many good characteristics that make it widely used in many fields.
|
First, the algorithm can prune the tree to determine the classification of some samples according to the types of fewer known clustering samples. |
Second, in order to overcome the inaccuracy of clustering of a small number of samples, the algorithm itself has an optimization iteration function. On the obtained clusters, iterative correction pruning is performed again to determine the clustering of some samples, which optimizes the unreasonable part of the initial supervised learning sample classification. |
Due to the advantages of K-means itself, we think it is suitable for our project.
Domain processing
After classifying the domains according to the surface shape, we considerd that users may not only need domain's shape classification, but also require domain sequence information, function information and other information.
Sequence information
Our sequence information mainly comes from PDB database, CATH database, SCOP and SCOP2 . Our domain division is based on the structure domain information recorded in the CATH database, SCOP and SCOP2. In addition, the original files come from the PDB database.
Function information crawling
In order to associate the function of the protein with the domain, we crawled the function tag corresponding to GeneProduct Annotation in the protein Annotation page on the PDB website. After that, taking the domain type as the unit, we calculate the probability of the occurrence of different function tags and extracted the function tags with high probability.
Combining recommendation
Probability of domain in the same protein
After reducing the redundancy, we calculated the combined probability of the entries in the domain database.
To furnish with constructive suggestions for binding domains of different types during protein design, the probability of each type combining with other type is provided through combining score. Users are able to search the domain type name and get its combination score with other types in our CPD3DS website.
Additionally, the combining score mentioned above is normalized to a 100*100 binding graph, where the darker the color is, the more likely domain binding is in the corresponding type of that row and that column.

Domain model processing
As it is difficult to perceive domain, we also designed a set of domain building block modules that can be spliced.


We have adopted two solutions here to design a series of spliced Domain models.
|
1. Using blender to process VRML2 (a scene model file, its expand name is ". wrl" ) exported from Pymol, or editing the fixed vertex shader processed by MeshLab . |
2. Preprocessing for pixel building block model |


|
3.Using the open source LSculpt [14] program, we converted the 3d model file into a Lego model file that LeoCAD can recognize. |
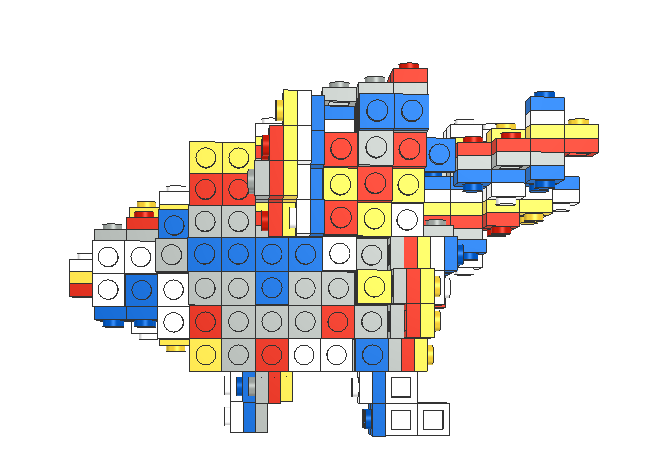

The model we got can be found on this page http://104.168.165.152/
Protein splitting
Considering that users may need to know the structure and composition of natural proteins in protein design, domains of natural proteins can all be found in our database. To ensure the integrity and simplicity of data, we chose the representative domain for each domain type.
References
Database References
[1]Sillitoe I, Dawson N, Lewis TE, et al.CATH: expanding the horizons of structure-based functional annotations forgenome sequences. Nucleic Acids Res. 2019;47(D1):D280-D284.doi:10.1093/nar/ gky1097
[2]Antonina Andreeva, Eugene Kulesha, Julian Gough, Alexey Murzin, TheSCOP database in 2020: expanded classification of representative family andsuperfamily domains of known protein structures. (2020) Nucl. Acid Res., 48(D1): D376-D382
[3]Antonina Andreeva, Dave Howorth, Cyrus Chothia, Eugene Kulesha, Alexey Murzin, SCOP2 prototype: a new approach to protein structu re mining. (2014) Nucl. Acid Res., 42 (D1): D310-D314
[4] Goodsell DS. The Protein Data Bank[M]// Atomic Evidence. Springer International Publishing, 2016.
[5]UniProt Consortium T UniProt: the universal protein knowledgebase. Nucleic Acids Res. 2018;46:2699. doi: 10.1093/ nar/gky092.
CD-hit References
[6]Weizhong Li, Adam Godzik, Cd-hit: a fastprogram for clustering and comparing large sets of protein or nucleotide sequences, Bioinformatics, Volume 22, Issue 13, 1 July 2006, Pages1658–1659, https://doi.org/ 10.1093/bioinformatics/btl158
[7]Ying Huang, Beifang Niu, Ying Gao, LiminFu, Weizhong Li, CD-HIT Suite: a web server for clustering and comparing biologicalsequences, Bioinformatics, Volume 26, Issue 5, 1 March 2010, Pages68 0–682, https: //doi.org/10.1093/bioinformatics/btq003
[8]Ying Huang, Beifang Niu, Ying Gao, Limin Fuand Weizhong Li. CD-HIT Suite: a web server for clustering and comparing biological sequences . Bioinformatics, 2010(26): 680-682.
[9]Weizhong Li and Adam Godzik. Cd-hit: a fastprogram for clustering and comparing large sets of protein or nucleotide sequences. Bioinformatics, 2006(22): 1658-1659.
[10]Weizhong Li, Lukasz Jaroszewski and AdamGodzik. Tolerating some redundancy significantly speeds up clustering of largeprotein databases. Bioinformatics, 2002(18): 77-82.
[11]Weizhong Li, Lukasz Jaroszewski and AdamGodzik. Clustering of highly homologous sequences to reduce the size of largeprotein datab ases. Bioinformatics, 2001(17): 282-283.
[12] MacQueen, J. Some Methods for Classification and Analysis of MultiVariate Observations[C]// Proc of Berkeley Symposium on Mathematical Statistics & Probability. 1965.
[13]David La, Juan Esquivel-Rodriguez, Vishwesh Venkatraman, Bin Li, Lee Sael, Steven Ueng, Steven Ahrendt, and Daisuke Kihara. 3D-SURFER: software for high throughput protein surface comparison and analysis. B ioinformatics 25: 2843-2844 (2009)
Model Reference
[14]LSculpt.Download from https://github.com/RomkoSI/lsculpt.