Team:UZurich/Results
Results
Expression and localization of the receptors in S. cerevisiae
Our first goal was to test whether the chassis would express the unaltered receptor and also whether it would localize the protein at the cell membrane.
Thus, we expressed the receptor together with a yellow fluorescent protein at the C-terminus of the protein to make expression visible.
Regarding the localization at the plasma membrane, it was at this point not clear if localization required a signal sequence native to S. cerevisiae or if the original signal peptide from the plant PRR would be functional in this organism. We created two versions of the constructs to test this, one with the original signal sequence at the N-terminus and one with the signal sequence from the alpha-mating Factor, a secreted pheromone from S. cerevisiae.
After transformation of S. cerevisiae cells and selection for successfully transformed cells on a synthetic dropout medium, we examined the cell cultures with multiple methods to get a better coverage of information about the expression of our constructs in the chassis. We first measured the fluorescence intensities of the cells with a plate reader and with a flow cytometer to examine whether expressing our constructs would lead to an increase in fluorescence with the wavelengths of YFP. While assessing fluorescence intensities is very helpful, its obvious limitations lie in its inability to localize the source of fluorescence within the cells. With this in mind, we also examined our cell cultures with confocal fluorescence microscopy. This approach allowed us to visualize YFP expression, while simultaneously examining the localization of fluorescence within the cells.
This was done for the full length receptors and for the receptor ectodomains alike. We managed to assemble the constructs with YFP for the BAK1 full length receptors with and without the native signal peptide (BAK+, BBa_K3610030 and BAK-, BBa_K3610031), the BAK1 ectodomain (eBAK, BBa_K3610032), the EFR ectodomain (eEFR, BBa_K3610045) and the ectodomain of the receptor CORE (eCORE, BBa_K3610046). FLS2 unfortunately could not be cloned correctly into an entry vector and thus had to be dropped.
Expression
In order to assess expression of our constructs, fluorescence was measured with a plate reader. When detecting and quantifying the fluorescence of different samples (λEx : 485 nm, λEm : 530 nm), transformed S. cerevisiae cells showed considerably higher fluorescence levels than the untransformed control, showing expression of our constructs fused to YFP in the transformed cells. Samples were measured with three biological replicates per construct.

Biological triplicates per construct with technical triplicates per sample, normalized for OD600 and zero referenced for autofluorescence levels of blank sample. Note: columns ‘CORE’ and ‘EFR’ refer to the ectodomain-only version of the receptors
It has been important to us to examine a sample with different approaches simultaneously, which is why we were eager to also measure fluorescence intensity by flow cytometry. In a first phase, 100,000 cells were measured from each biological replicate (488/530 FITC channel in a BD FACSCanto II flow cytometer).
In the next phase, the biological replicates for each construct were pooled together and 200,000 cells from each sample were measured.

Left: Distribution of fluoresence intensity in 4 samples per construct. Right: Pooled samples for each construct, showing distribution of fluoresence intensity. All except eCORE show higher intensity.
The measurements made with the flow cytometer confirmed what had been observed previously with the plate reader. With the exception of the construct with eCORE, cells transfected with our constructs showed considerably higher overall fluorescence intensities than the negative control. This observation provides further evidence for expression of our constructs in S. cerevisiae.
Localization
After evaluating the results from the fluorometer we examined the yeast samples with confocal fluorescence microscopy. We examined cells for YFP fluorescence (λEx = 514 nm, λEx = 527 nm) and in addition to that, cells were stained with FM4-64, a dye which stains the plasma membrane but gets quickly endocytosed, which is why one may see vesicles stained with FM4-64. If the constructs get expressed in S. cerevisiae, we should see a strong increase in yellow fluorescence. If the constructs also get localized at the plasma membrane (PM), we should be able to observe colocalization of YFP and the FM4-64 stain.

Figure 1: Untransformed S. cerevisiae
A: YFP, B: FM4-64, C: light field, D: merged
Untransformed samples show very little fluorescence in the YFP spectrum
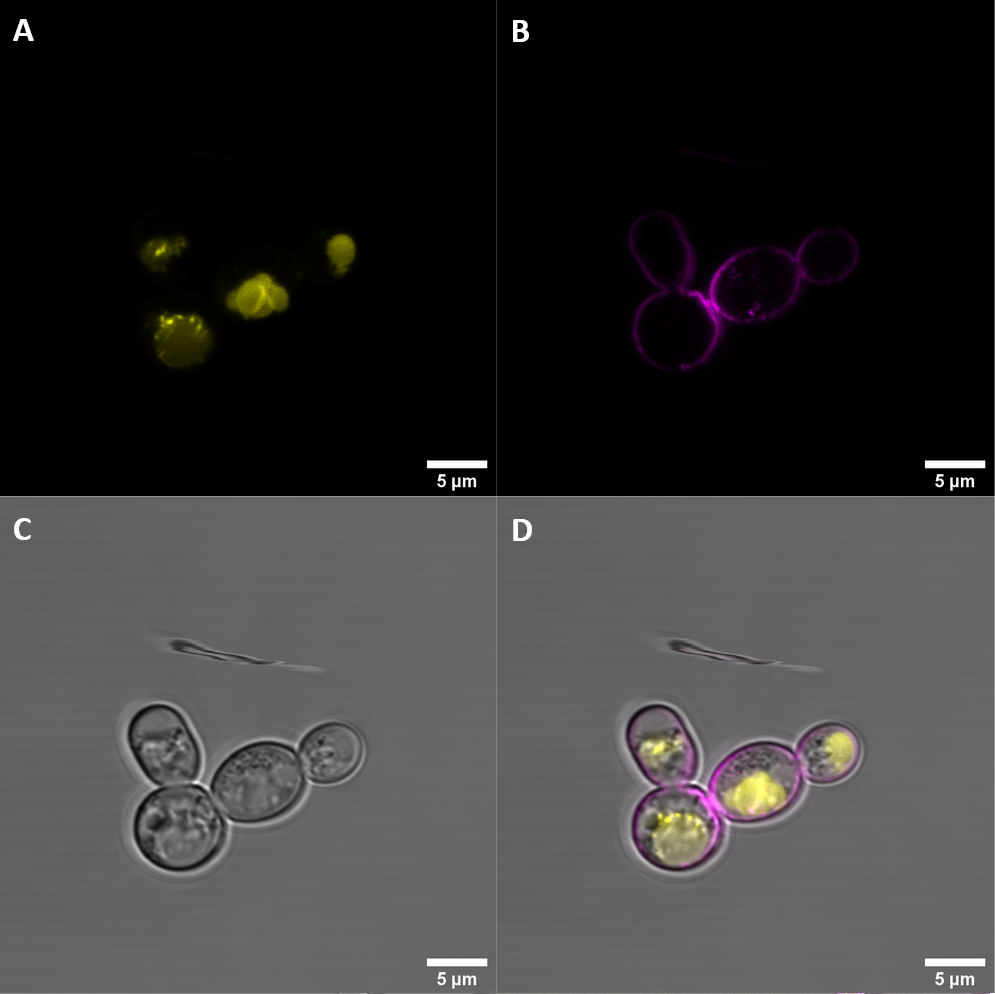
Figure 2: BBa_K3610030 (BAK+)
BAK+ shows moderate YFP fluorescence which is not co-localized with FM4-64, indicating that it is not localized at the membrane

Figure 3: BBa_K3610031 (BAK-)
BAK- shows strong YFP fluorescence with little co-localization with FM4-64, indicating that some gets trafficked to the membrane

Figure 4: BBa_K3610032 (eBAK)
Most cells show strong fluorescence, clear co-localization with FM4-64 in a ring structure in about 1% of cells

Figure 5: BBa_K3610045 (eEFR)
Co-localization at the membrane in about 25% of cells. Dense clumps in the cell indicate that many constructs still get stuck

Figure 6: BBa_K3610046 (eCORE)
Cells show weak fluorescence situated in the vacuoles rather than the membrane
What we observed with the microscope was in alignment with our expectations after evaluating the results from the fluorometric analysis. Cell transfected with the receptor ectodomain of eCORE did not show increased fluorescence levels when examined with a plate reader. Similarly, fluorescence microscopy also indicated very weak yellow fluorescence and no localization at the cell membrane was visible.
BAK1+ cells did show an increase in fluorescence when examined with the fluorometer, but to a much lower degree when compared to the constructs containing the signal peptide from S. cerevisiae (with the exception of eCORE). The same observation was made under the microscope. BAK+ cells showed increased fluorescence which was not co-localized with the FM4-64 stain, indicating that this construct did not get integrated into the plasma membrane.
The other three constructs which were examined with the confocal microscope, the BAK1 ectodomain (eBAK, BBa_K3610032), the BAK1 receptor with the signal peptide from S. cerevisiae (BAK-, BBa_K3610031) and the EFR ectodomain (eEFR, BBa_K3610045), showed much stronger fluorescence. This was the case when they were examined with a plate reader and with the fluorescent microscope.
Additionally, cells transfected with plasmids containing the eBAK and eEFR show clear localization of our constructs at the cell membrane. The proportion of the cells which display co-localization with FM4-64, however, varies strongly. In BAK- cells, the overlap between the yellow fluorescence and the membrane stain is rather scarce, but nevertheless observable, which indicates that some of it gets trafficked to the cell periphery.
eBAK cells did show high fluorescence and in about 1% of the cells a very clear ring structure was visible at the cell membrane. eEFR cells were of similar appearance. In this case about 25% of the cells had clearly localized the construct at the plasma membrane.
The results from the plate reader and the confocal fluorescence microscopy suggest that our constructs, the ectodomain of BAK1 and EFR and the full length receptor BAK1 with the signal sequence from the alpha-Factor are actually expressed in S. cerevisiae. BAK1 with the native signal peptide is expressed as well and eCORE is probably expressed at very low levels. Additionally, microscopy imaging suggested that the eEFR and eBAK are localized at the cell membrane. This localization at the cell periphery is a big success as it shows that the signal peptide from the alpha-Mating factor did, in fact, induce translation into the membrane. Additionally, it was shown that the intracellular kinase domain is not necessary for membrane localization, but much rather caused the construct to get stuck in what seems to be the cellular vacuoles.
Having achieved expression of these PRRs in S. cerevisiae and demonstrated that they get integrated into the plasma membrane opens the doors to many future applications of PRRs in this organism.
Dimerization of the receptors in S. cerevisiae
For our system to be working two things are required. The receptor and co-receptor must be able to interact, enabling them to dimerize, leading to a reconstitution of NanoBit parts to catalyze the luminescence-accompanied reaction of furmazine to furimamide. The dimerization, further, must be driven by the epitope to which the receptor is specific.
Testing dimerization using split NanoLuc
To test this, we transformed S. cerevisiae to express both a receptor - eCORE (BBa_K3610051) or eEFR (BBa_K3610043), each fused to NanoLuc SmallBiT - and the co-receptor eBAK1 (BBa_K3610038) fused to NanoLuc LargeBit at the same time.
In a first assay, the substrate furimazine and the bacterial elicitors were added to the samples and then incubated for 30 minutes. After this incubation with substrate and the bacterial epitopes, the samples were examined with a luminescence reader. All samples were brought to the same optical density (OD600 = 0.34).
The results of the luminescence assay showed increased luminescence when samples were examined which had previously been transfected with the plasmids containing the constructs, especially when the S. cerevisiae cells had been transfected with plasmids containing the eEFR construct. The results, however, suggest that the dimerization of the NanoLuc parts was not driven by ligand-dependent interaction of the receptors.

Dimerization assay with eEFR/eCORE and eBAK. Shown are luminescence levels 30min after addition of no epitope, elf18 or csp22
To get more data, a second assay was performed, this time only with eEFR samples.
In the second assay, the luminescence levels were measured immediately after addition of the bacterial elicitors, elf18 or csp22, and the substrate furimazine. All samples were brought to the same optical density (OD600 = 0.26).

Dimerization assay with eEFR and eBAK. Shown are luminescence levels directly after addition of furimazin and no epitope, elf18 or csp22
The assay was repeated a third time. This time, the substrate was added to the samples and then they were incubated for 30 minutes, after which the bacterial elicitor was added, this time only elf18, and the samples were measured directly. The samples were, again, resuspended in order to keep them at the same OD.

Dimerization assay with eEFR and eBAK. Shown are luminescence levels 30 min after incubating the samples in Nanoluc substrate
Multiple assays have been performed with the NanoBit constructs. Each time, the LargeBit and SmallBit parts were able to dimerize to a functional NanoLuc protein, which was made evident by an increase in luminescence after addition of furimazine. Addition of bacterial epitope did not further increase the levels of luminescence, which indicates that the interaction between the NanoBits is not driven by ligand-dependent interaction of the receptors. It therefore seems that the bacterial epitope elf18 does not induce an interaction between BAK1 and EFR when they are expressed in S. cerevisiae. This, however, needs further examination.
Testing dimerization using Co-Immunoprecipitation
Another way to test for dimerization is Co-Immunoprecipitation
Beads were treated with anti-FLAG antibodies. To these beads, whole cell lysate of yeast cells with eBAK::LargeBiT and eEFR::SmallBiT was added. One sample has been treated with elf18, while the other was not. This was to investigate if elf18 induces dimerization. The eEFR contains the FLAG tag and is thus expected to bind to the AB-treated beads. If eBAK interacts with eEFR upon exposure to elf 18, it should attach itself to the beads by binding to eEFR. All proteins which attach themselves can then be eluted from the beads and visualised via Western blotting. eEFR is visualized with anti-FLAG-HRP and eBAK with anti-HA-HRP. There are six different protein samples which get visualized via western blotting:
- Input mock, which is untreated whole cell lysate
- Unbound mock, which is the fraction of the untreated whole cell lysate which didn’t attach to the AB-treated beads
- Input elf18, which is whole cell lysate which has been treated with elf18
- Unbound elf18, which is the fraction of the whole cell lysate treated with elf 18 which didn’t attach to the AB-treated beads
- IP unbound, which is the fraction of the untreated whole cell lysate which attached to the AB-treated beads
- IP elf18, which is the fraction of the elf 18 treated whole cell lysate which attached to the AB-treated beads

Unfortunately the blot which should have visualized eBAK1 doesn’t show any clear bands, thus making it impossible to determine if dimerisation occured. What we can see is the blot which visualises eEFR. Interestingly, there are 3 distinct bands in each lane, suggesting that eEFR exists in 3 different forms of eEFR with different weights. This could be caused by post translational modification like glycosylation. We see that the lowest band at around 70 kDa appears weaker in the column with the unbound cell lysate compared to the input, suggesting that eEFR attaches itself to the beads treated with anti-FLAG as expected. This band at 70 kDA then again shows up in the columns containing the fraction which was eluted from the beads. Interestingly, there are also two thick bands above 70 kDa in these eluent columns, which doesn’t really make sense, as we would expect to see a difference in the thickness of these bands between the columns containing the whole cell lysate and the flow-through, but there the bands seem relatively similar.
Testing dimerization using split mCherry
To ensure we could test our approach of a system which would generate an output with a split-protein system, even if we had failed to assemble our constructs with the NanoLuc protein, we aimed at having a system put to test with a different reporter protein. We chose to use mCherry.
The activity of these constructs were assessed in the same manner as the ones using NanoLuc. A fluorescence assay was performed (λEX = 587nm and λEM = 610nm), using samples of the same optical density (OD600 = 0.5).

Dimerization assay of samples cotransformed with eEFR fused to split-mCherry (BBa_K3610034) and eBAK fused to split-mCherry (BBa_K3610040)
In this case, presence of the bacterial elicitor elf18 seems to increase fluorescence. Since this is, however, the case for for both yeasts containing our plasmid and untransformed yeast, we cannot conclude that this has been achieved through ligand-dependent receptor dimerization, especially when considering that the fluorescence levels were not increased when transfected S. cerevisiae cells were examined, in fact, there was no significant difference between the untransformed control and the samples with cells containing the plasmids with our constructs. It is clear that this deserves further examination. We propose to repeat the measurements to increase the data coverage and rule out errors during pipetting or labelling the samples. It should further be attempted to lower autofluorescence for yeast cells that resemble the fluorescence of mCherry.
Part Improvement: Codon-optimize NanoLuc LargeBit for S. cerevisiae
In order to further characterize the split-NanoLuc system, we compared the luminescence levels of a system using the LargeBit sequence from the registry (BBa_K1761005) with a system using a new sequence which had been codon optimized for expression in S. cerevisiae (BBa_K3610014).
In order to drive the interaction between the two NanoBits the two sequences were fused to the sequences encoding FKBP12 and FRB, which are rapamycin ligands that are used to drive protein-protein interaction.
Plasmids containing the constructs FRB:SmallBit and FKBP12:LargeBit, were used to transfect S. cerevisiae cells. This was done twice. In one case, the LargeBit sequence was codon optimized for expression in yeast (BBa_K3610055), while one yeast culture was transfected with plasmids containing the original sequence (BBa_K3610054).


Both: Luminescence levels of codon-optimized and normal NanoLuc LargeBit with and without Rapamycin. The codon-optimized version shows slightly higher luminescence.
Initial comparison of the average luminescent output measured by the plate reader indicated similar levels of expression. A increased luminescence could be detected when the codon optimized sequence was used.
Further steps
Our experiments using the NanoBiT® system, while showing that some dimerization occurs between BAK1::LBit+EFR::Sbit, showed no response to the elicitor of EFR, elf18, which makes it difficult to adapt this system into a usable biosensor as is. This absence of a response might be due to the absence of negative regulators which are always present in plants together with the PRRs. These negative regulators are called BAK1-interacting-receptor-like kinases 2 and 3 (BIR 2 and 3) which bind to BAK1 in the absence of elicitors [1]. The coexpression of BIR 2 and 3 might be a promising attempt to reduce the amount of signal in the absence of elicitors.
As we have seen during confocal imaging, the absence or presence of the kinase domain on the receptors plays a major role in the localisation of the receptors. We have seen that only a small fraction of yeast cells expressing BAK1 without kinase domain localise said receptor on the plasma membrane. This means that only a few cells co-localise eBAK1 and eEFR, which reduces the potential for dimerization. It would certainly be worthwhile to investigate the trafficking of full length EFR and to see if it localises inside the vacuoles, like full length BAK1. Then it needs to be investigated if dimerization can be induced by elf18 when these receptors are co-localised inside of the vacuole instead of the plasma membrane.
It might also just be that the receptors don’t get expressed correctly in yeast, either due to incorrect folding or other post-translational processes, like glycosylation. This is why a future team working on this project should focus on expressing our constructs in Chlamydomonas reinhardtii, something we were very keen on doing, but for which we, unfortunately, didn’t have any time.
Expanding our construct design to increase modularity
If we manage to get a visual output in response to the elicitors, we can think about building upon our design to make them more modular. When using constructs which rely on the complementation of fluorescent or chemiluminescent proteins, we are inherently limited by the amount of these proteins available, as finding the correct split site in a protein is no trivial task. In addition, the constructs that we designed up until now should deliver a visual output very quickly after exposure to an elicitor, but the strength of the output is heavily dependent on the amount of receptors in the plasma membrane. If the output of one receptor pair is quite weak, it would require a greater amount of receptors to be expressed, which might place a metabolic burden on our chassis. This is why we thought about a system which would induce a signal cascade upon dimerization instead of an immediate visual output, leading to the expression of a desired reporter protein. We found that the NTHU Formosa team developed a system which would be applicable for this vision. They utilized nanobodies, or split antibodies, situated in the cell membrane which would dimerize upon exposure to a specific antibody [2]. They attached two fragments of the split tobacco etch virus (TEV) protease to these Nanobodies. Upon dimerization, the TEV protease would cut the TEV cutting site which is attached to one half of the split TEV protease, which would then release a transcription factor that initiates expression of a reporter. We think that this system holds great potential to be adapted in combination with our receptors, as these nanobodies act quite similarly to our PRRs.
[1] Couto, D. and Zipfel, C., 2016. Regulation of pattern recognition receptor signalling in plants. Nature Reviews Immunology, 16(9), p.537
[2] https://2018.igem.org/Team:NTHU_Formosa