Team:GunnVistaPingry US/Results
The goal of this project is to determine which sgRNA strands are best suited for use with CRISPRi. We improved upon the existing Machine Learning Algorithm to create a model to find quality sgRNA. 812 possible correlative factors in 18 genes were considered, with 180 used to train the model and 10 records of the EIFG1 gene as test data. A total of 13 factors were found to have meaningful correlation in predicting sgRNA success. The training data set was randomly divided into 17 gene folds where each fold has a further distribution of 94% and 6% for training and test data sets respectively.
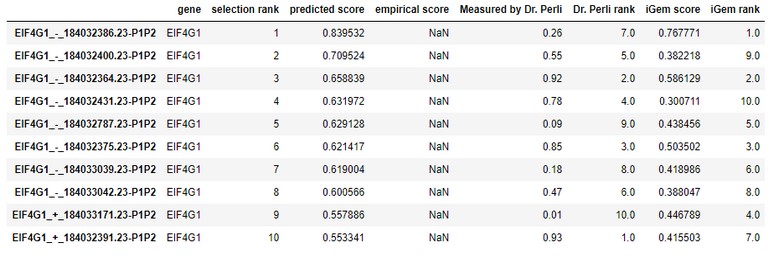
Below is the table of scores predicted by the Weissman Lab’s Algorithm, the iGEM Algorithm, and team advisor Dr. Perli’s lab score.
When we compared the Mean Tweedie Deviance for the Weissman Lab’s Scores and iGEM Scores with the ones measured in the lab for the gene EIF4G1, we found the following results.
Weismann: 0.14461545542489534
iGEM: 0.1387975491703964
https://scikit-learn.org/stable/modules/generated/sklearn.metrics.mean_tweedie_deviance.html
We have used Mean Tweedie Deviance calculation with power value ZERO, calculating Mean Square Error.
We clearly see that the iGEM scores are closer to lab scores with a lower deviance value.
We also measured the deviance against all other genes for which Weissman Scores and Lab Scores are available. Unlike EIF4G1 above, the guide scores of the genes measured in the lab were used to train the model. Nevertheless, the scores predicted by the model are still meaningful as ML models do not remember trained data, instead they remember features impacting the score along with the weights of those features.
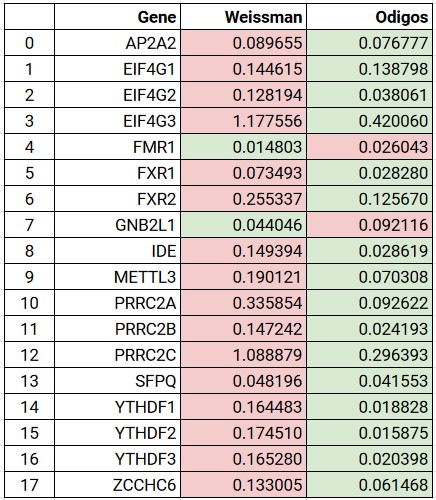
Clearly, it can be seen that except for two genes (FMR1 and GNB2L1), for all other genes the, scores measured by the iGEM algorithm are very close to lab scores.
During our research, we also found out that the scores measured in the lab were based on qRT-PCR and have quadratic correlation with the distance of the guide RNA from TSS.
The following diagrams are the scatter plots of the scores against distance of the guide from TSS:
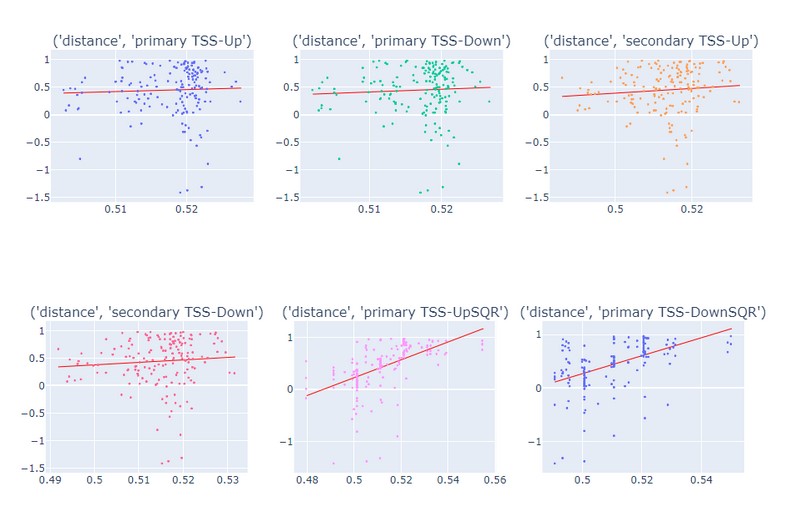

Clearly, the distance is in a nearly quadratic relationship to the score, while the relationship to the square of the distance is linear.
After adding the square of the distance as a dependent parameter, our regression model found it as one of the features that explain the score.
Below is the table of scores predicted by the Weissman Lab’s Algorithm, the iGEM Algorithm, and team advisor Dr. Perli’s lab score.
When we compared the Mean Tweedie Deviance for the Weissman Lab’s Scores and iGEM Scores with the ones measured in the lab for the gene EIF4G1, we found the following results.
Weismann: 0.14461545542489534
iGEM: 0.1387975491703964
https://scikit-learn.org/stable/modules/generated/sklearn.metrics.mean_tweedie_deviance.html
We have used Mean Tweedie Deviance calculation with power value ZERO, calculating Mean Square Error.
We clearly see that the iGEM scores are closer to lab scores with a lower deviance value.
We also measured the deviance against all other genes for which Weissman Scores and Lab Scores are available. Unlike EIF4G1 above, the guide scores of the genes measured in the lab were used to train the model. Nevertheless, the scores predicted by the model are still meaningful as ML models do not remember trained data, instead they remember features impacting the score along with the weights of those features.
Clearly, it can be seen that except for two genes (FMR1 and GNB2L1), for all other genes the, scores measured by the iGEM algorithm are very close to lab scores.
During our research, we also found out that the scores measured in the lab were based on qRT-PCR and have quadratic correlation with the distance of the guide RNA from TSS.
The following diagrams are the scatter plots of the scores against distance of the guide from TSS:
Clearly, the distance is in a nearly quadratic relationship to the score, while the relationship to the square of the distance is linear.
After adding the square of the distance as a dependent parameter, our regression model found it as one of the features that explain the score.